Beside the standard dashboard that comes with the default installation, the vCenter Operations Manager allows you to create your own custom dashboard to meet your specific needs. The design process is done using the custom portal and not in the administration portal. The custom portal can be accessed by typing the FQDN/IP address of the UI virtual machine in the internet browser followed by /vcops-custom/. For example: https://10.10.13.28/vcops-custom/
In this example, I’ll create a custom dashboard that will provide extensive information about datastores in your environment.
Create Custom Dashboard
- Open your browser and navigate to https://<FQDN_or_IP_address_vCOps>/vcops-custom/
- Login with the administrator account.
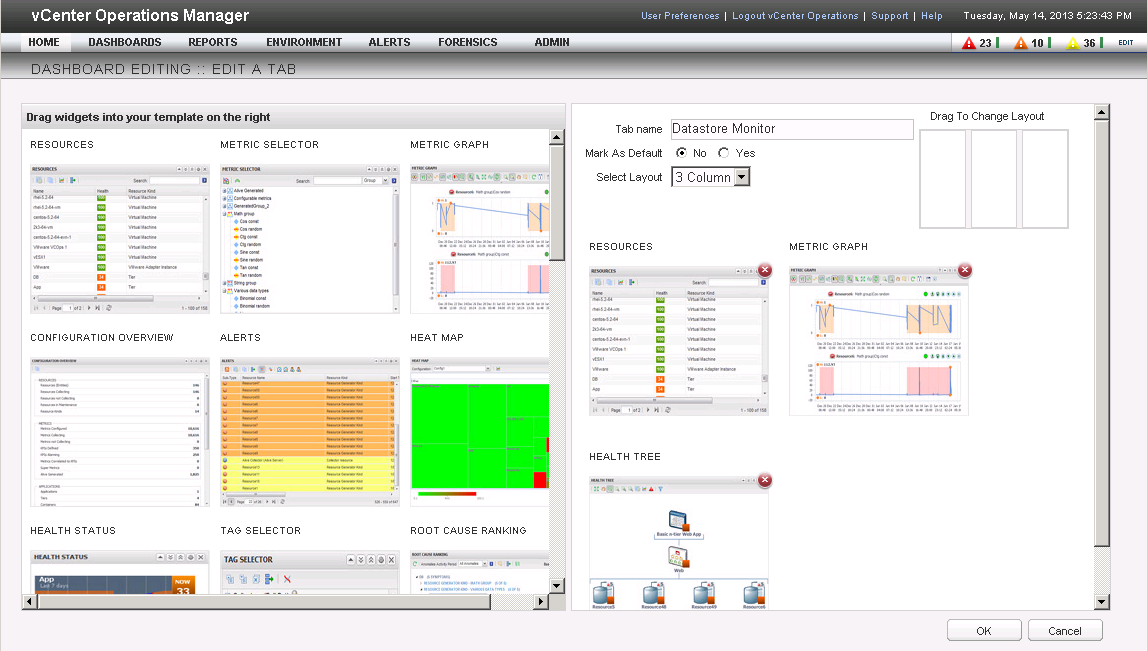
- Navigate to the Dashboard menu and select Add. A new dashboard editing tab will open.
- You can create a new dashboard using widgets by dragging them into the area on the right or you can create a new dashboard from a dashboard template. In this case, I’ll go with the widgets option. If you want to use the dashboard template option, click the icon in the top left to switch the view.
- Select and drag the Resource, the Metric Graph and the Health Tree widget to the right pane.
- Provide a name for the dashboard in the Tab Name text box, for example Datastore Monitor.
- Optionally, mark this dashboard as the default dashboard.
- Select the 3 column layout.

- Click OK to create the new dashboard.
Configure Widgets
- Rearrange the widgets over the columns. And make it a bit bigger with the “double arrow down” button.
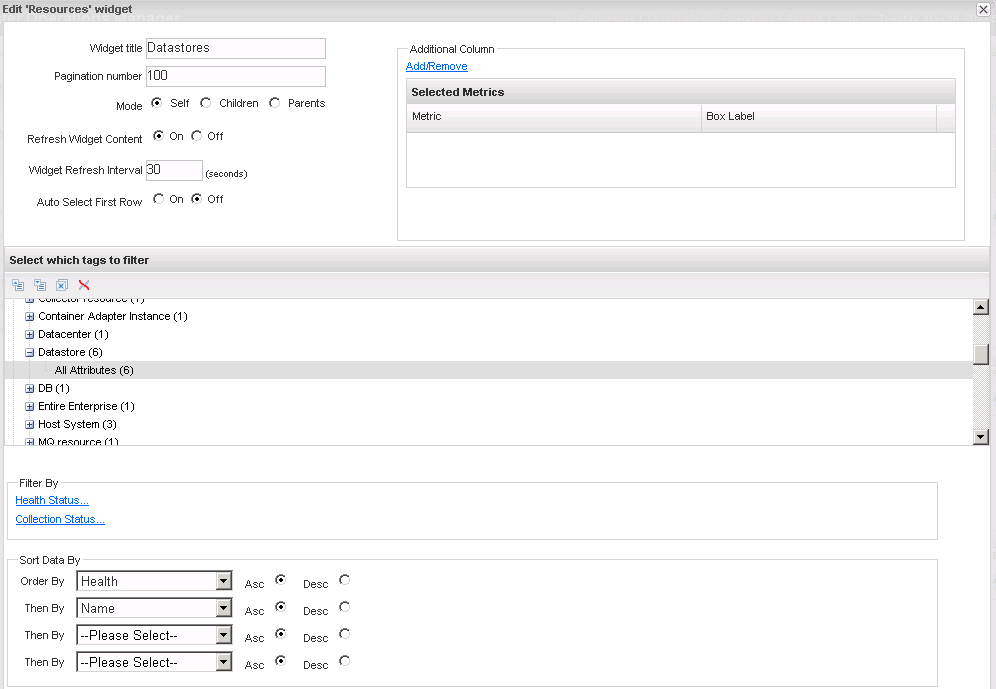
- Select the Resource widget and click the gear button.
- Enter a widget title, for example Datastores.
- Set the Refresh Widget Content to On.
- From the tags filter, scroll down to Datastore, expand it and select All Attributes.
- In the Sort Data By pane, select the first order as Health and the second as Name.
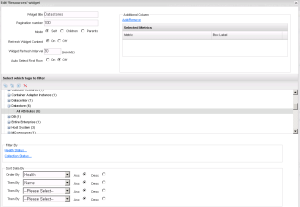
- Click OK to save the changes.
Configure Interactions
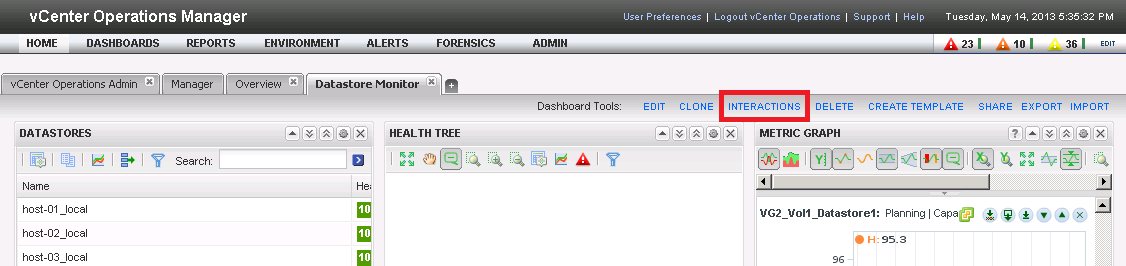
- From the Dashboard Tools menu click Interactions.
- Set the providing and receiving widget as depicted below and click OK.
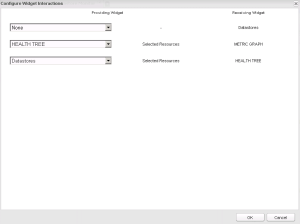
- Click OK to save and close the Interactions window.

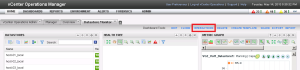
You can now select one of the datastores and see the results in the health three windows as well as extensive information about this particular datastore in the metric graph window.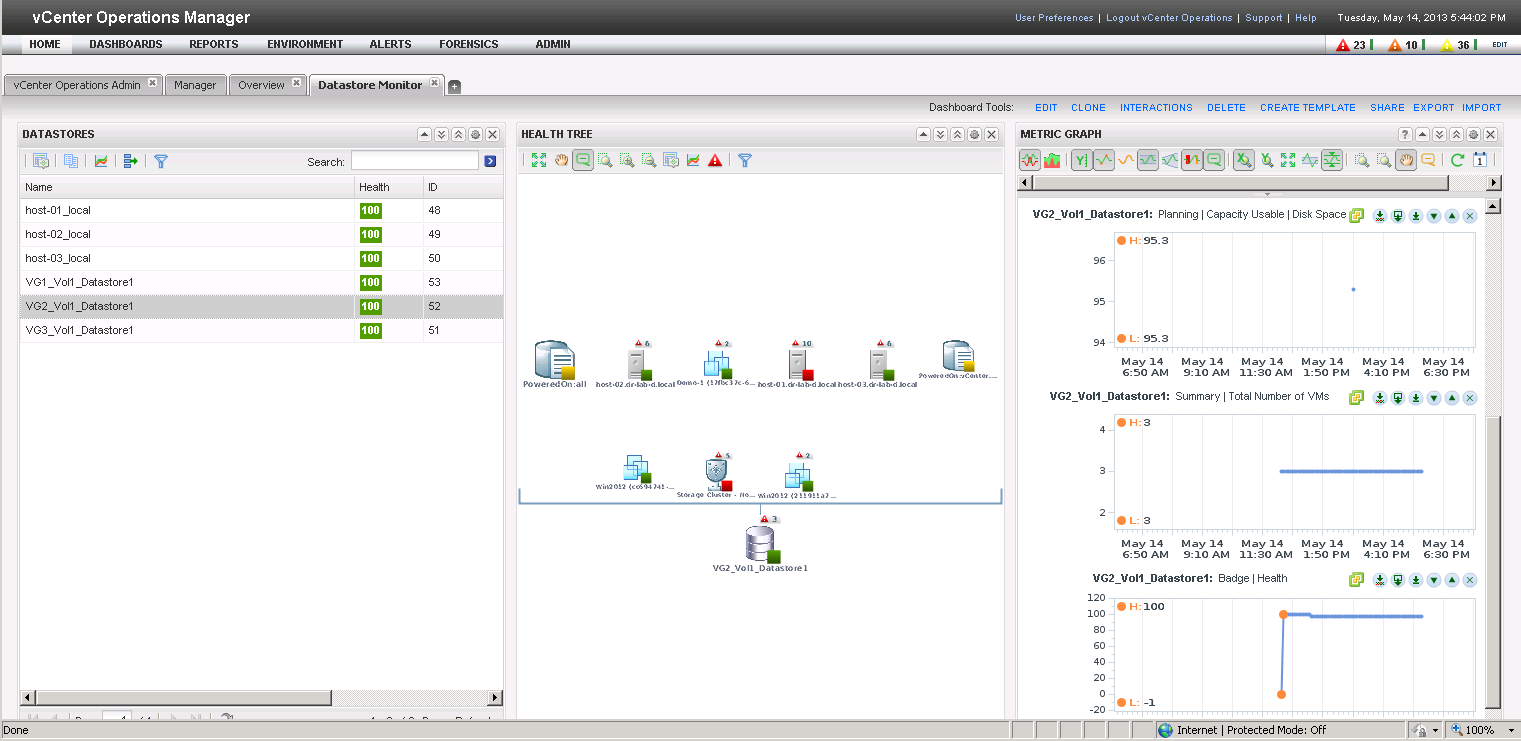
This is of course a very simple example of a custom dashboard and it can be easily be extended with other widgets or refined using other filter criteria.
This concludes the vCenter Operations Manager part of this vCloud Suite POC. The product is very extensive but provides you with good information about your environment. The powerful custom dashboard editor enables you to gather a vast amount of information to troubleshoot and forecast your environment.
Continue to part 16 where we will take a closer look at the vCloud Automation Center.
Cheers!
– Marek.Z
- vCloud Suite POC Part 1: Introduction
- vCloud Suite POC Part 2: Installing vCloud Director Cell
- vCloud Suite POC Part 3: vCloud Director Configuration
- vCloud Suite POC Part 4: Creating a new Provider vDC
- vCloud Suite POC Part 5: Creating new Organization
- vCloud Suite POC Part 6: Add and Publish Catalogs
- vCloud Suite POC Part 7: Create New vApp
- vCloud Suite POC Part 8: Add vCloud Connector
- vCloud Suite POC Part 9: Move VM to the Cloud
- vCloud Suite POC Part 10: Add vCenter Chargeback Manager
- vCloud Suite POC Part 11: Install and Configure vCenter Chargeback Manager
- vCloud Suite POC Part 12: vCenter Chargeback Manager Cost Analysis and Reporting
- vCloud Suite POC Part 13: Add vCenter Operations Manager
- vCloud Suite POC Part 14: Configure vCenter Operations Manager
Have you been able to configure a URL that passes a username, password & dashboard to allow for auto login? We are trying to figure out how to do this for our NOC. Any tips would be appreciated.
Hi Nathan,
Unfortunately, no I haven’t. But I guess you will have to add vC Ops to your SSO instance. I didn’t have time to look into it.
Cheers!
while adding the datastore i am not seeing all attributes for me .. i am seeing all my individual datastores … how to add all in one
What step are you at Syed?